Infographic prepared especially for Palm Springs Modernism Week and used in "Where Canitlever Meets Coyote" presentation on Postwar Modern Architecture in Phoenix.
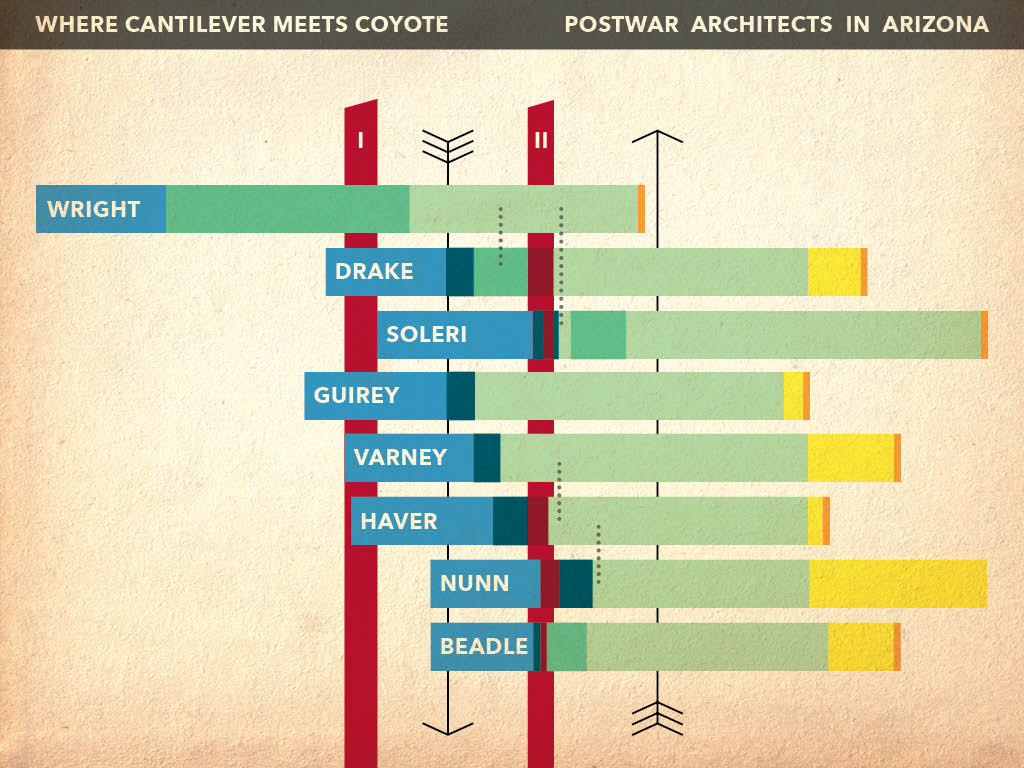
It wasn't until I visually charted out all the lifelines of my favorite architects that I was able to fully appreciate their impact and interaction with each other -- and their ages and stages of progression.
The meaning of the infographic does not have a visual key but is explained during lecture in real time. Before you read the key below, look a while longer and see if you can puzzle it out!
• • • • • • • • • • • • • • • • • • • • • • • • • • • • • • • • •
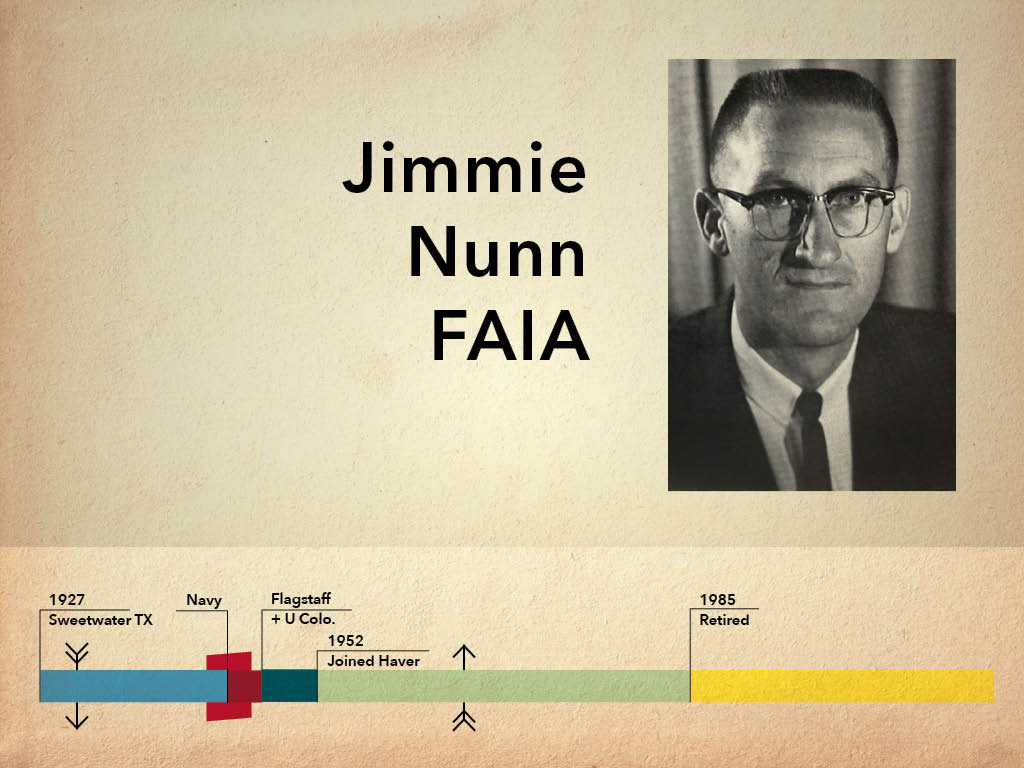
KEY | Light Blue = Childhood | Dark Blue = College | Dark Green = Apprenticeship | Light Green = Adult Career | Yellow = Retirement | Orange = Year of Death
Down Arrow = The Stock Market Crash of 1929
Up Arrow = The High Point of Arizona Modernism in 1962
Red = World Wars and their impact on their lives
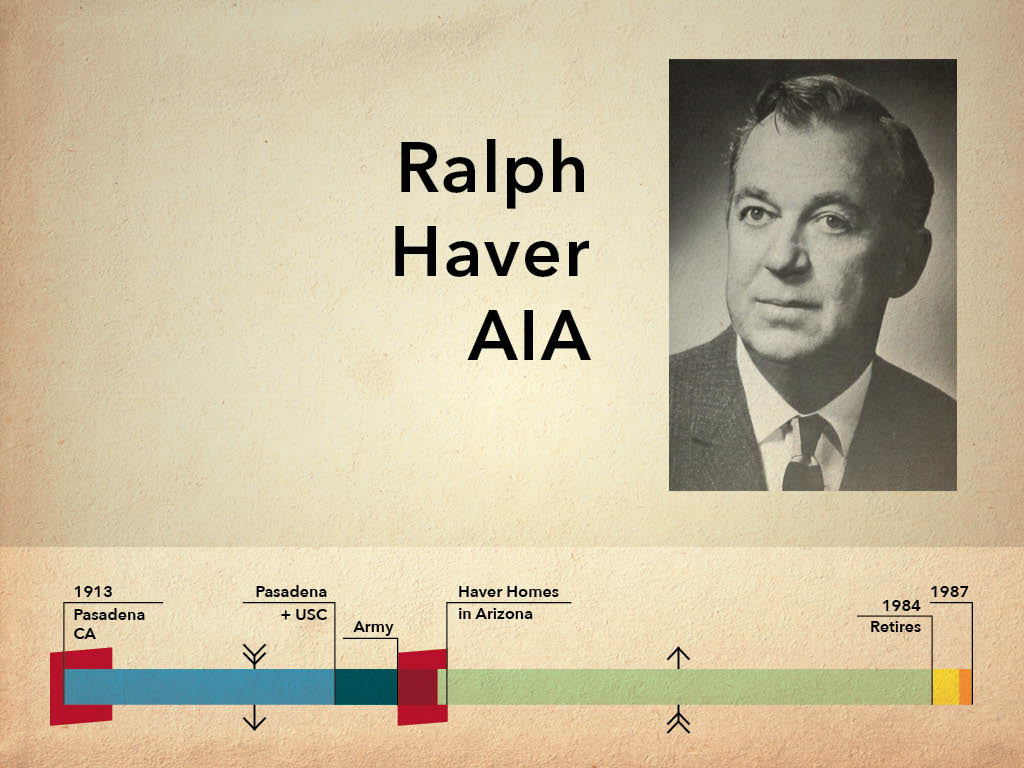
TItle cards showing biographical information on Ralph Haver and Jimmie Nunn using the same key described above